
Ultimate Guide to Google PageSpeed Insights in Singapore (2021)
Posted on: September 3, 2020
According to research by Google, 53% of users will leave a mobile webpage if it doesn’t load within three seconds.
As such, it is critical that digital marketers design fast web experiences so people can stay and view more pages on the site, convert more and buy more. As Google once said, speed equals revenue.
The PageSpeed Insights tool is a great resource to help you identify and fix issues that could potentially slow your site down. Because the speed of your website has an impact on SEO and conversion rates, there’s a need for improvement.
Read on to find out more about PageSpeed Insights and how to improve your website’s speed performance.
1. What is PageSpeed Insights
Page speed comprises of two factors:
- Time to first byte – how long it takes for a browser to receive the very first byte from a web server
- Page load time – the time taken to fully display content on a page
PageSpeed Insights is one of the tools developed by Google to help webmasters analyse their site’s speed, in mobile and desktop devices, and understand its performance. It also provides suggestions on the recommended fixes.
The tool provides lab and field data about a page. Lab data is collected in a controlled environment and is used for debugging performance issues. However, there may be limitations in capturing real-world bottlenecks. As such, field data helps to capture true, real-world user experience but has a smaller set of metrics to work with.
2. How does PageSpeed Insights work
When you first run a page analysis in PageSpeed Insights, the report will return different sections and indicates about its performance.
At the top of the report, the speed score will be shown. This score is determined by running Lighthouse, an open-source, automated Google tool to help improve the quality of web pages.
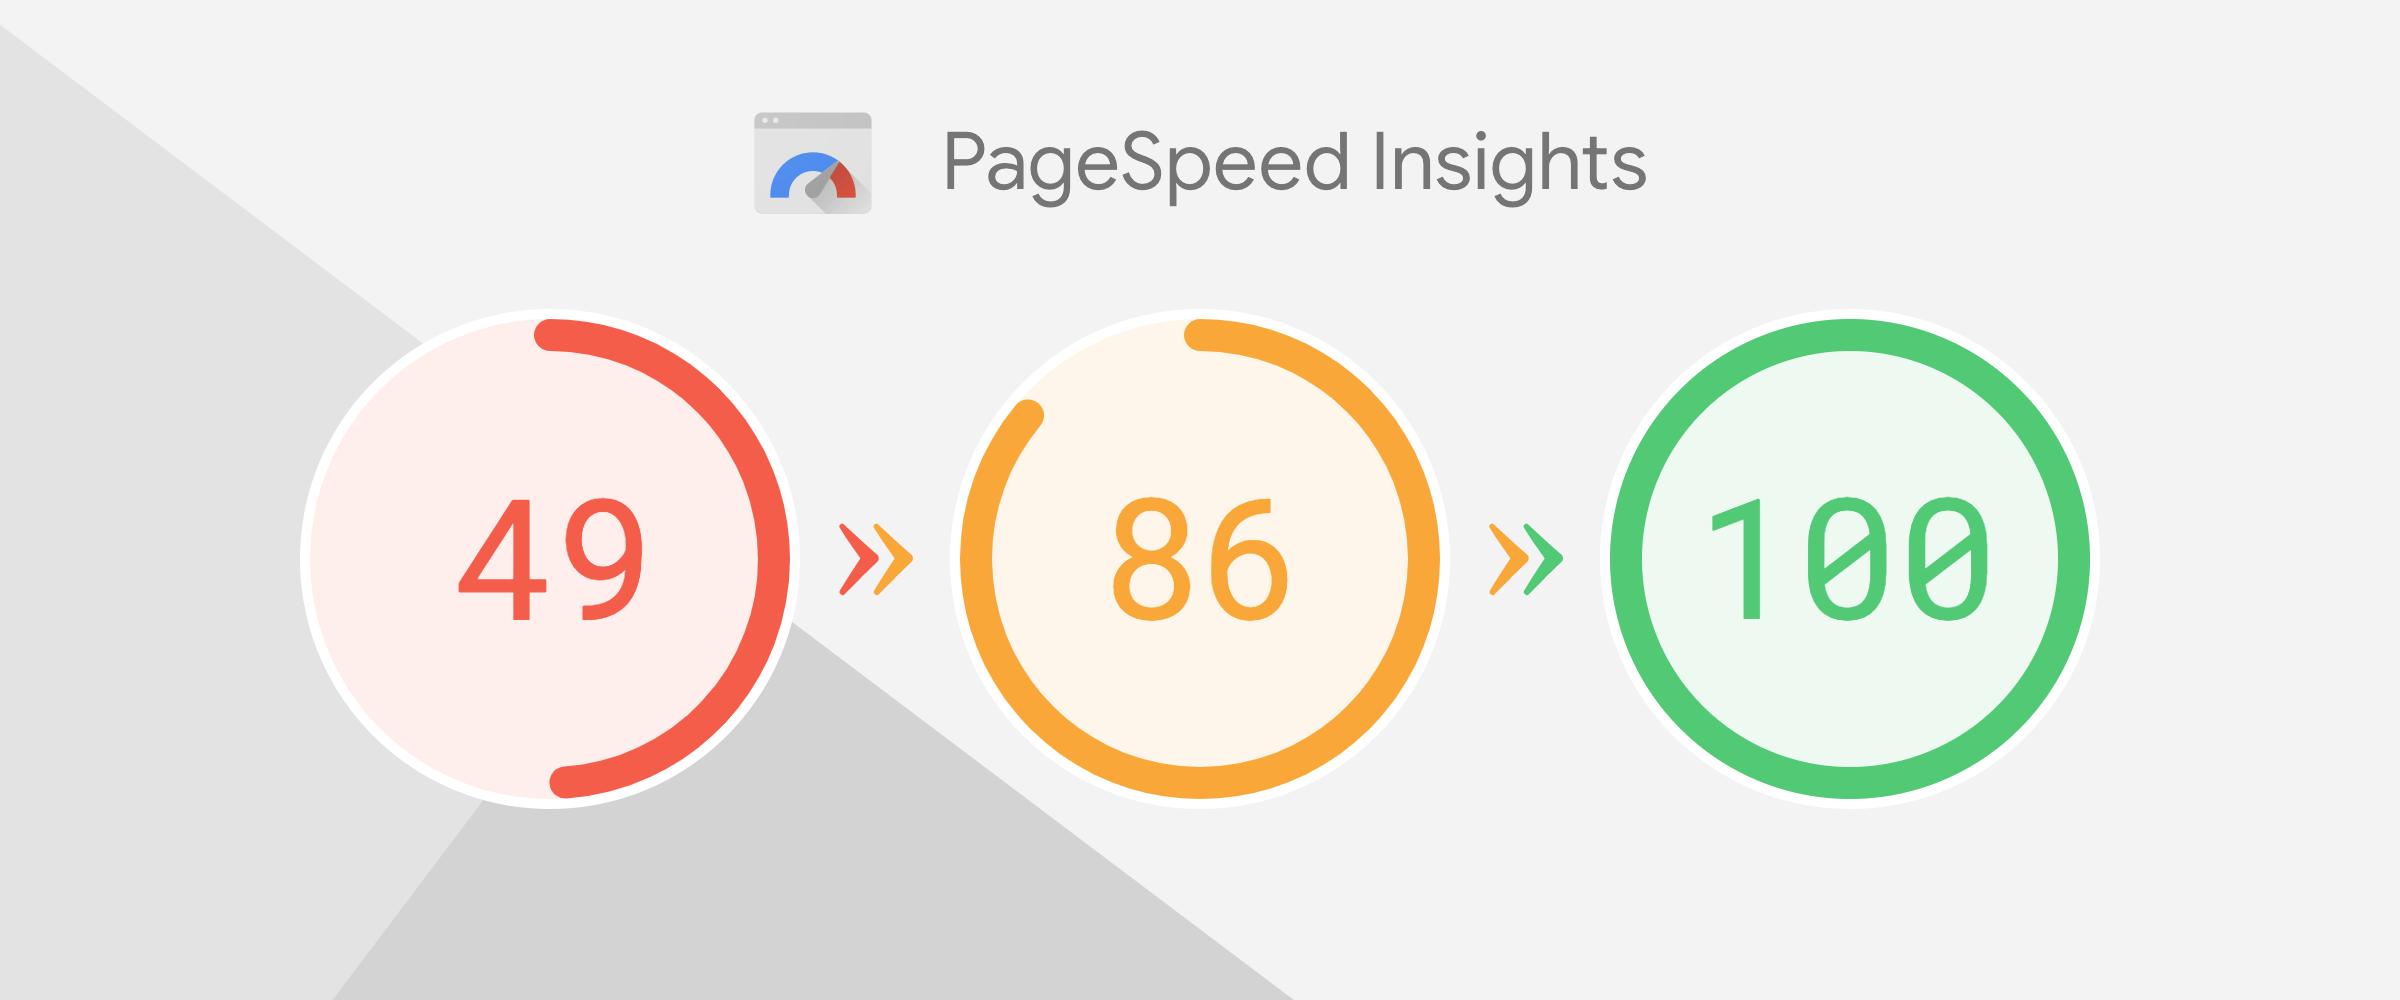
Lighthouse will collect and analyse lab data on the page. The tool will show you a performance score out of 100. Google classifies a score of 0–49 (red) as “slow”, 50–89 (orange) as “average” and 90–100 (green) as “good”.
3. What are the metrics used for real-world field data
Apart from the performance score, you will also need to know the metrics used to calculate it and how to interpret it.
Field data reports how real-world Chrome users experience popular URLs on the web through the Chrome User Experience Report (CrUX), which is powered by performance metrics gathered from users of Google’s Chrome browser.
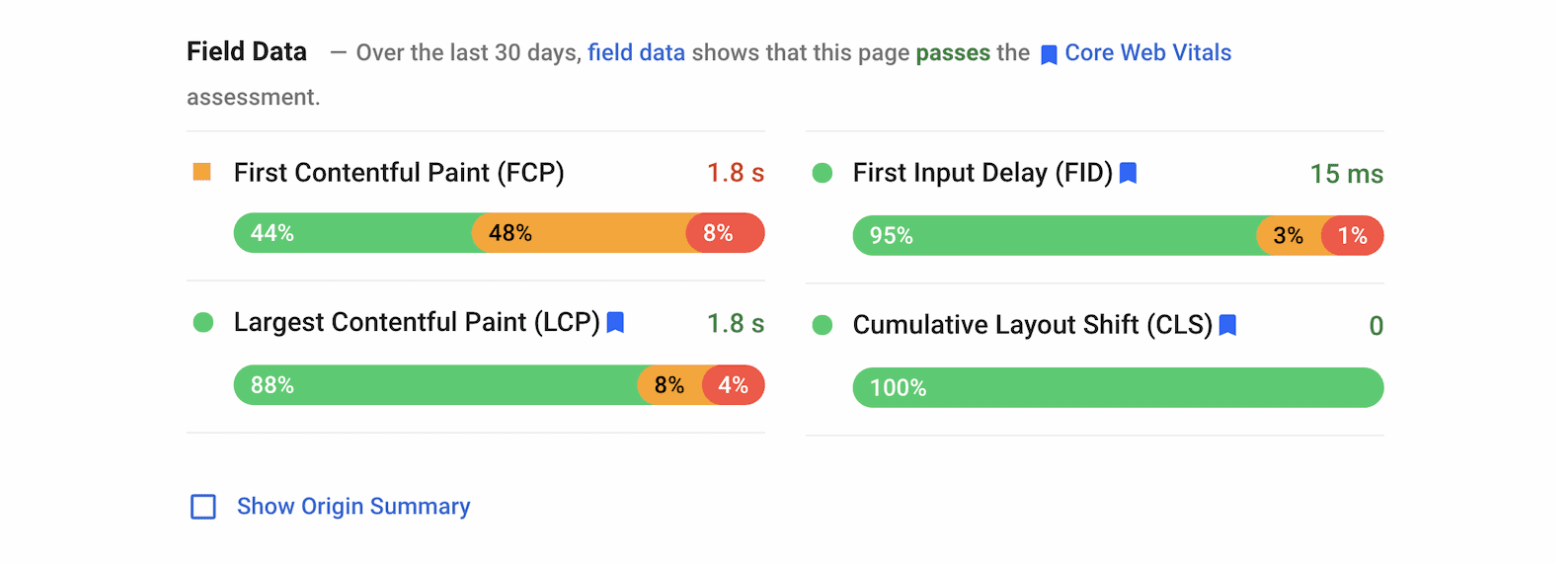
The report includes metrics like:
- First Contentful Paint (FCP) – measures perceived load speed to show the user that a page is starting to load
- First Input Delay (FID) – measures load responsiveness and how quickly the page responds to a user’s input (e.g. a mouse click)
- Largest Contentful Paint (LCP) – measures the time to render the largest image or text block visible within the user viewport
- Cumulative Layout Shift (CLS) – measures visual stability and quantifies how often users experience unexpected layout shifts
The report will also indicate whether the page passes the Core Web Vitals assessment. You can view a summary for the origin and the specific URL you are testing. But if there is insufficient real-world data speed data, you will only be able to view ‘lab data’.
In both sets of data, the same traffic light colouring system is used to classify and indicate performance for each field metric value: green for ‘good’, orange for ‘needs improvement’, and red for ‘poor’.
The 75th percentile is reported for all metrics to reflect good user experience and ensure that the pages work well for the majority of users.
4. What are the metrics used for lab data
Lab data is based on the Lighthouse analysis of the page, based on a simulated load of a page and a set of network conditions. It generates a performance score based on metrics such as:
- First Contentful Paint (FCP) – measures how long it takes for the browser to begin displaying the first elements of the site
- Largest Contentful Paint (LCP) – measures how fast visible content for users loads.
- Cumulative Layout Shift (CLS) – measures the significance of unexpected layout shifts on a page
- Speed Index – shows how quickly the contents of a page are visually displayed
- Time to Interactive – how long it takes for the page to become fully interactive
- Total Blocking Time – how long a page is unresponsive and blocked from responding to user input before becoming reliably interactive
Next, Lighthouse will provide an audit that is split into three sections.
Opportunities provide recommendations on performance metrics that could improve the page’s loading time. The suggestion in this section includes an estimate of how much faster the page will load if the recommendation was implemented.
Diagnostics share additional information about the performance of your application and which best practices for web development should be added to the page.
Passed audits indicate all the performance checks that the page already passed and does not require any intervention.
5. What is a good PageSpeed score and how to improve it
Obtaining a green PageSpeed Insights score can feel rewarding, but scoring 100/100 isn’t necessarily the end goal. In fact, even without achieving a full score, you can still have a fast-loading site.
That’s because the real indicator of quality for a page is its loading time, instead of the PageSpeed Insights score. When your site has a lower loading time, it can achieve better overall score. With PageSpeed Insights, you can easily detect problem spots to optimise your site and decrease your loading time.
With that said, the better the score, the more you can assume your site is in good shape – and this is advantageous in the eyes of Google to increase your ranking in the SERP.
Image optimisation
When images are not properly optimised, this is a common reason why a web page has slow load time. You can make improvements by optimising image size, choosing size images at their display size, and deferring offscreen images.
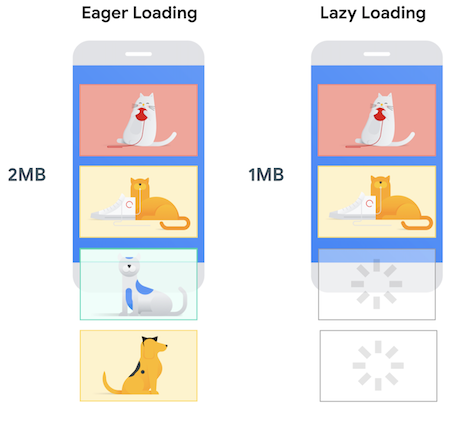
To defer offscreen images, consider the technique of lazy loading which defers the loading of resources on the page until they are actually needed. This reduces the number of images needed to be loaded on a page up front, which means fewer bytes to download and more performance gains. One tip is to install a lazy-load WordPress plugin that allows to defer any offscreen images.
Another way you can improve your loading time is to compress and reduce the image size. According to statistics by HTTP Archive, the average web page size is 2.4MB, and images contribute over 60% of it. When you reduce the image size, you get to lower web page size overall and load your web page faster to eventually help in SEO ranking.
You can use a WordPress plugin such as WP Smush to help reduce the size whenever you upload the images, or a standalone tool like TinyPNG. Also available as a WordPress plugin, TinyPNG utilises smart lossy compression techniques to lower the file size of JPG or PNG files without visible loss in quality.
Improve server response time
Reducing the server response time is also good for your site’s performance. Measured by TTFB (Time to First Byte), this refers to the time taken for a user’s browser to receive the first byte of page content. The more time it needs to load, the more it can significantly affect user experience and your ranking on the SERP.
The first step is to establish the core conceptual tasks that your server must complete to return page content and measure the time it takes. Then, you can begin to search for ways to speed them up.
Improving the server response time can be done by a number of ways, such as choosing a high-quality web hosting provider, reducing the number of plugins installed on your site, and implementing browsing caching.
Image file type
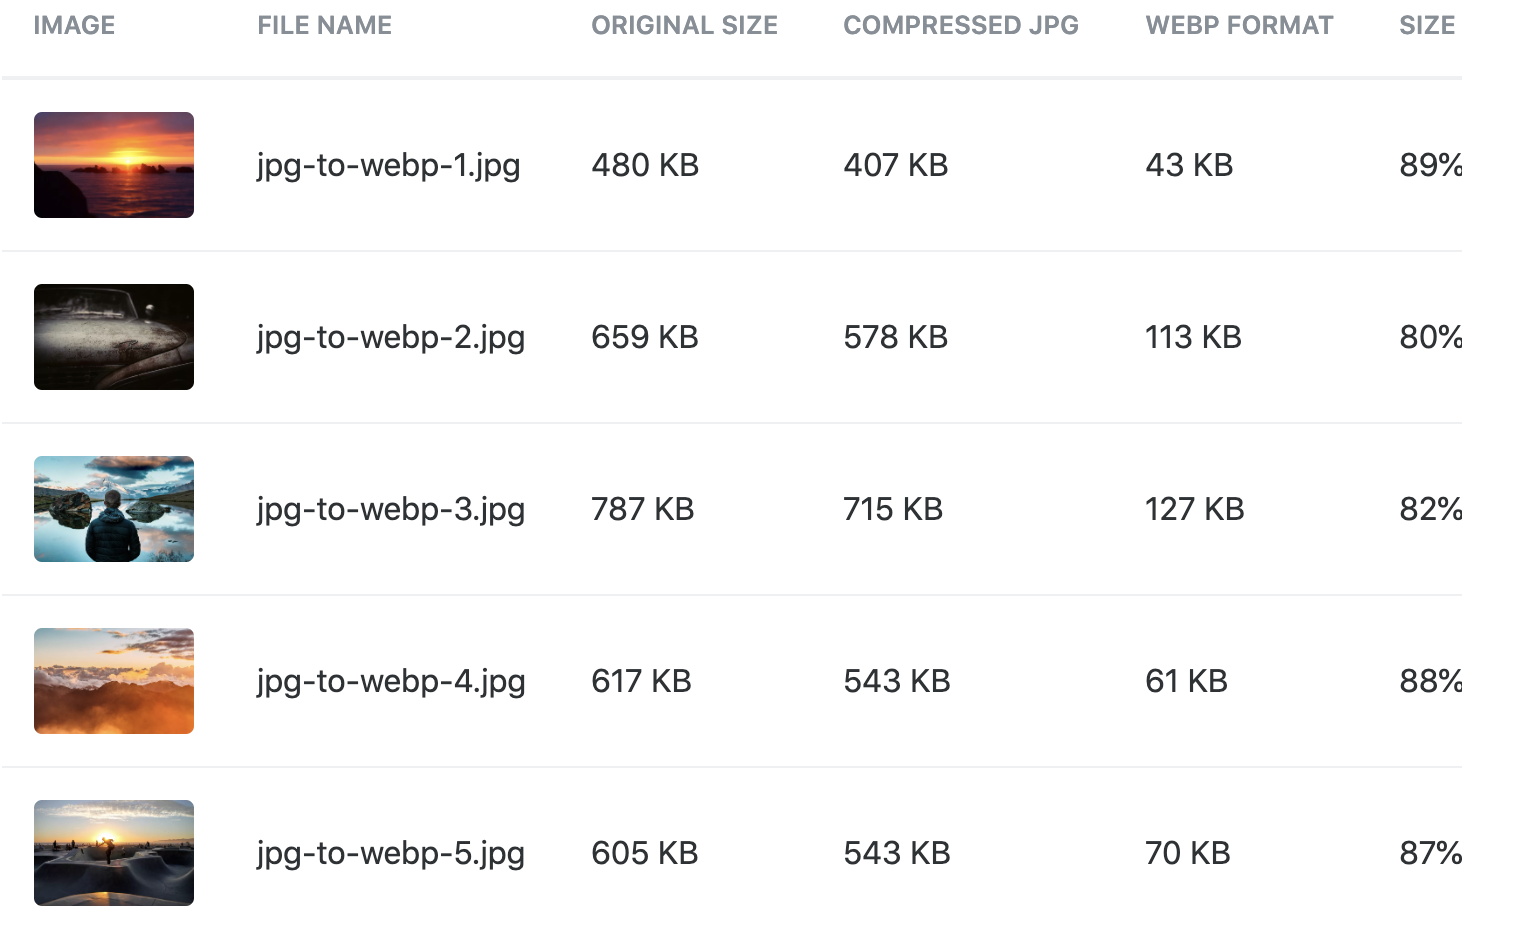
The smaller your image files are, the faster your website will load. Developed by Google, WebP is an image format that delivers lossy and lossless compression of images on a site. Compared to older formats like JPEG and PNG, WebP has superior compression and quality characteristics. Images can get down to a smaller size without any visible quality loss. In comparison to PNGs, WebP lossless images are 26% smaller.
WebP is only supported in certain web browsers such as Google Chrome and Opera, but you should be able to gain similar savings in an alternative next-gen format like JPEG 2000 and JPEG XR. Save 2 versions for each image for your web pages to deliver the correct file to each device and browser. There are several ways to compress your images in WebP including the WebP plugin for Photoshop and ImageMagick’s convert tool.
Conclusion
Aside from looking at the speed score, focus on implementing the platform’s recommendations to help identify areas of improvements and create more benefits for your site.
Google PageSpeed Insights is no doubt a useful tool for developers, webmasters and site owners. Hopefully this article will shed some light into understanding how it works and enable you to use it to your advantage.
But for some, it can be easy to get confused in the jargon and technical terms and have a misinterpretation on the results. If you’re unsure on how to be more hands-on with your site, work with a digital marketing agency and tap on the expertise of digital marketing specialists! Armed with the necessary skills and experience, they can do the heavy lifting to help you improve your website’s performance and deliver a better user experience.